EDR Setup (Simple)
If a term is unfamiliar, open the Glossary.
EDR (Endpoint Detection & Response) lets Dralvia collect security events from your servers and laptops. It also lets you isolate a host if you see suspicious behavior.
This guide is written for first‑time users. Follow the steps exactly.
1) What you need from Dralvia
Your Dralvia contact will give you these values:
EDR_API_BASE(usehttps://dralvia.tech/api)EDR_LICENSE_TOKEN(required)EDR_API_KEY(required for host activation)- Optional:
EDR_AGENT_KEYand/orEDR_ATTESTATION - Optional:
EDR_HTTP_TIMEOUT(seconds, default 30) - Optional: a list of allowed IPs your agents must send from
If you do not have these values, stop and contact Dralvia support before continuing.
2) Choose a Host ID (one per machine)
Pick a stable host ID for each machine. Examples:
acme-web-01acme-db-02
Do not change the host ID later unless you want a new host record.
3) Download the EDR sensor
In the Dralvia UI go to Security Operations → Endpoint Agent Downloads and click Download zip. For Windows endpoints, download Windows installer (.exe) when available. For Linux/macOS endpoints, download Linux/macOS standalone binary when available.
4) Install the EDR sensor
Install the package you downloaded:
- Linux: use the Linux standalone binary when available; otherwise run script from bundle.
- macOS: use the macOS standalone binary when available; otherwise run script from bundle.
- Windows: use the Windows installer (
.exe) and activate with API key.
5) Configure the sensor
Set these environment values on the host:
EDR_API_BASE=https://dralvia.tech/api
EDR_LICENSE_TOKEN=<token from Dralvia>
EDR_HOST_ID=<your chosen host id>
EDR_PLATFORM=linux|windows
Windows installer zero-command flow (recommended):
- Double-click
dralvia-edr-agent-*.exe. - Complete first-run setup prompts (API base, license token, workspace API key, host ID, disable password).
- Keep Start with Windows enabled.
Expected first-run dialog (normal):
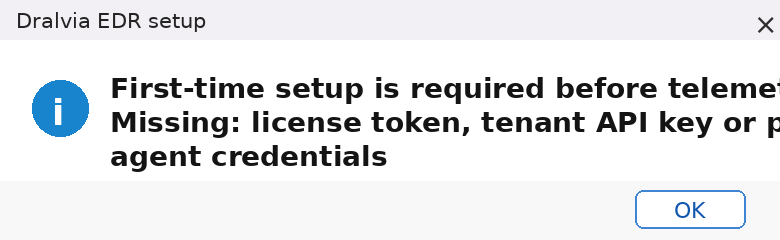
If first launch reports missing values, this is setup validation, not a crash. Use:
- API base URL:
https://dralvia.tech/api - License token: signed workspace JWT issued by your workspace owner/internal admin
- Workspace API key: from workspace UI
#/api-keys - Host ID: endpoint identifier (example
georgepc1) - Disable password: workspace-admin disable secret
Optional scripted activation flow (if your operations team requires command-driven rollout). In #/edr-agent, fill in
Workspace API key, Host ID, and Disable password first, then copy the generated command:
$env:EDR_LICENSE_TOKEN = "CHANGE_THIS_TO_YOUR_LICENSE_TOKEN"
Start-Process -FilePath .\dralvia-edr-agent-windows.exe -ArgumentList '--api https://dralvia.tech/api --api-key CHANGE_THIS_TO_YOUR_API_KEY --host-id CHANGE_THIS_TO_YOUR_HOST_ID --platform windows --activate --disable-password CHANGE_THIS_TO_TENANT_ADMIN_DISABLE_PASSWORD' -WindowStyle Hidden
The process keeps running after PowerShell/CMD is closed. Confirm in Task Manager. If your build includes tray UI, use Debug Bundle for support diagnostics. Disable requires local admin rights plus backend authorization with the workspace-admin disable password.
If Dralvia provided extra credentials, add these:
EDR_AGENT_KEY=<agent key>
EDR_ATTESTATION=<attestation token>
6) Start the sensor
Start the service and keep it running. It should begin sending events within a minute.
7) Verify it works
- Open the Endpoint Protection in Dralvia (
#/edr-console). - Start on Overview to see total devices, recent activity, and any isolated devices.
- Open Hosts and confirm the host appears and shows a recent check‑in.
- Open Telemetry for recent device events, or Isolation for isolate/release audit history.
- If you see errors like
agent_key_requiredorip_not_allowed, contact Dralvia support to confirm your credentials and allowlist. - If you see
attestation_stale, rotate your host attestation in Endpoint Agent Downloads and restart the agent. - If you see
agent_revoked, that host was decommissioned; ask your admin to re-enable credentials. - If you see
Could not find a suitable TLS CA certificate bundlereferencingcertifi\\cacert.pem, re-download the latest installer from#/edr-agent(2026.03.03.2or newer). Normal installs do not require local CA setup.
What you get
Boundary classification: add-on security module.
Dralvia expands this module only when customer demand, evidence quality, support readiness, and clear operating limits are in place.
Use the standard Dralvia evidence workflow and TicketBridge handoff for escalations where this module produces reviewable evidence.
Integration boundary: signed agent enrollment, host telemetry ingestion, console review, controlled host isolation, and standard evidence handoff.
Once the sensor is active, Dralvia will:
- Ingest process/network events and ransomware canary alerts.
- Allow isolation from the Endpoint Protection when needed.
- Record actions in EvidencePacks (Dralvia's exportable evidence reports) for audit trails.
For response workflows, see Endpoint Response Guide.
Who this is for
This guide is for workspace owners, workspace admins, and security operators who need clear, repeatable steps without support intervention for day-to-day execution.
Role-based start here
- Workspace Owner: Start with Before you start, then complete Step-by-step and Known limits and rate limits.
- Workspace Admin: Focus on Step-by-step, What each button does, and API and automation.
- Security Analyst: Start at Day-2 operations and Troubleshooting, then use API error quick reference.
- Integrator/Engineer: Start at API and automation, then validate with Step-by-step and FAQ.
Before you start
Use this short checklist before making changes:
- Confirm you are signed into the correct workspace account.
- Confirm your role includes the permissions needed for this page.
- Confirm your browser session is fresh (if pages behave unexpectedly, sign out/in once).
- Confirm required prerequisites (API keys, agent enrollment, license, upstream integrations) are already in place.
Step-by-step
Follow this sequence for predictable results:
- Open the workspace from the workspace menu.
- Review current status/health/last update indicators before making changes.
- Apply one change at a time and save.
- Run the available validate/probe/refresh action.
- Confirm the expected output appears (status change, new event, successful result).
- If behavior is not as expected, use Troubleshooting below before repeating actions.
Day-2 operations
After initial setup, keep this surface healthy with a simple routine:
- Daily: verify data freshness and error banners.
- Weekly: review trends, limits, and failed actions.
- Monthly: review permissions, keys/tokens, and stale entities.
- After any incident: capture evidence and update your internal operating notes.
What each button does
Button labels can vary by module, but behavior is consistent:
- Refresh: reloads the latest data from backend APIs without changing configuration.
- Save: persists workspace-scoped configuration changes.
- Run/Probe/Validate: executes a non-destructive health or verification action.
- Download: fetches workspace-scoped artifact(s) (for example bundle, checksum, signature, or report).
- Verify: checks integrity/consistency and returns pass/fail details.
- Enable/Disable: toggles module behavior for your workspace; audit evidence should be recorded.
If a button appears disabled, check role permissions, required fields, and workspace license/feature entitlement first.
Self-check playbook
Use this 5-step isolation flow before escalating:
- Configuration: confirm required inputs are present and formatted correctly.
- Permission: confirm your role can perform the action (
401/403usually indicates authz/authn mismatch). - License/feature: confirm the feature is enabled for your workspace plan and module toggles.
- Quota/rate limit: check for
429responses and cooldown windows. - Service health: if you see
5xx, retry once after 30-60 seconds and capture exact error text.
If still failing, escalate with workspace ID, UTC timestamp, route, action, payload shape (no secrets), and screenshot/error response.
Troubleshooting
Use this quick triage order to reduce time-to-fix:
- Auth/session: refresh token by signing out/in.
- Workspace context: confirm you are in the correct workspace.
- Inputs/config: verify required fields and formats.
- Quota/license: confirm limits and feature entitlement.
- Service health: retry after short delay if backend is transiently degraded.
For escalation, include workspace ID, timestamp (UTC), route name, action attempted, and full error message.
API and automation
Everything in this page should remain workspace-scoped. If your team prefers automation, use the corresponding API endpoints with the same guardrails as the UI:
- Use authenticated requests bound to your workspace context.
- Use idempotency/retry controls where available.
- Validate outcomes in the UI after automated runs.
If your endpoint mapping is not obvious, start from Help Center and follow the linked API docs.
Next best actions
After finishing this page, continue with related workflows so your workspace setup stays end-to-end complete:
- EDR response and host actions
- Web Access Protection and dry-run events
- Identity risk and OAuth response
- EvidencePack verification and transparency log
- Risk economics and plan recommendation
FAQ
Q: I clicked save but nothing changed. A: Refresh once, confirm permissions, and verify required fields.
Q: Why do I see missing API key/unauthorized errors? A: Confirm your workspace API key/session is valid and mapped to the correct workspace scope.
Q: Can non-admin users use this page? A: Usually read-only access is possible; write actions require workspace-admin or equivalent roles.
Next steps
After finishing this guide:
- Validate the result in the related dashboard/workspace.
- Export or capture evidence if this affects compliance/incident operations.
- Share the same runbook internally so other operators follow identical steps.
- Return to Help Center for adjacent workflows.
API error quick reference
Use this matrix when a UI action fails with an HTTP/API error.
| Error | Meaning | What to do now |
|---|---|---|
401 Unauthorized | Session token is missing/expired or request is not authenticated. | Sign out/in, refresh once, then retry. Confirm your session is active in the correct workspace. |
403 Forbidden | You are authenticated but your role is not allowed to perform this action. | Confirm your role includes the required permission for this button/action. Ask workspace admin to grant access. |
404 Not Found | The route/resource does not exist in current workspace context (or feature not enabled). | Confirm URL/route, workspace context, and feature availability. Refresh and retry; if persistent, capture timestamp and route and contact support. |
429 Too Many Requests | Rate limit/quota window was exceeded. | Wait for cooldown/reset window, retry once, then reduce burst traffic/backoff if automated. |
500 Internal Server Error | Backend failed unexpectedly while processing the request. | Retry after 30-60 seconds. If still failing, escalate with workspace ID, UTC time, route, action, and full error text. |
Known limits and rate limits
These limits can vary by plan and feature, but behavior is consistent:
- Burst traffic can trigger
429 Too Many Requests. - Workspace quotas apply per feature/module and reset on configured windows.
- Repeated retries without backoff can extend recovery time during saturation.
Recommended operator behavior:
- Retry once after cooldown for 429 responses.
- Use exponential backoff in automation.
- Monitor usage/quota dashboards for sustained high utilization.
- Request quota review when normal workload regularly approaches limits.